
Trading the Rectangle Chart Pattern requires Patience
The Rectangle Chart Pattern is one of the most commonly recurring themes in the Forex markets. As you may know, price tend to move in trends and in between, prices undergo periods of consolidation. This consolidation can take shape in different forms, the rectangle chart pattern being one of them.
This horizontal consolidation in price occurs usually after a strong trending move (uptrend or downtrend). Following this move, price action tends to settle down into a horizontal range. This horizontal range can take the shape of a rectangle. Price tends to move in this range for a significant amount of time, following which a breakout occurs.
Typically, the rectangle chart pattern can occur as a continuation pattern. This means that when you see a rectangle chart pattern after an uptrend, you can expect price to continue to the upside, and vice-versa for the downtrend. But this is not the case all the time. Besides acting a reversal chart pattern, the rectangle chart pattern can also signal a reversal pattern, which will see prices moving in the opposite direction.
However, such reversal rectangle patterns can be seen either at the tops or at the bottoms of a price trend. The rectangle pattern typically occurs in stocks where prices tend to move sideways for a couple of months, if not longer. Trading with the rectangle pattern can be done in almost all markets and across all timeframes. The logic behind this pattern being that is quite simple to catch the rectangle chart pattern with relative ease.
However, in order to be successful with the rectangle chart, patience is of the essence. Taking an entry ahead of the breakout can result in the position being caught on the wrong side and can lead to significant losses. Secondly, as with all chart patterns, some discretion is required.
How is the Rectangle Chart Pattern formed?
The Rectangle Chart Pattern, as the name suggests evolves as prices move within a specified range. The highs and lows are formed and price tends to range within these levels for a considerable period of time. This period is also known as accumulation period and comes ahead of a new trend.
The rectangle pattern needs at least two reaction highs and two reaction lows. In other words, there has to be two highs and two lows formed for the rectangle pattern to be created. These levels are also known as resistance and support levels. In some markets where volume is applicable, you can notice volume can be random at best when the rectangle pattern is formed.
Still, the volumes within these consolidation periods are lower. The pattern can last for weeks or months, or even hours, depending on the time frame which forms the context. The chart below shows how a typical rectangle pattern is formed. In figure 1, you can see how price moved into a sideways range, forming the rectangle chart pattern. This was later followed by a bullish breakout to the upside. You can also see how the rectangle pattern was formed after price previously declined, thus making this pattern a reversal pattern in this instance.
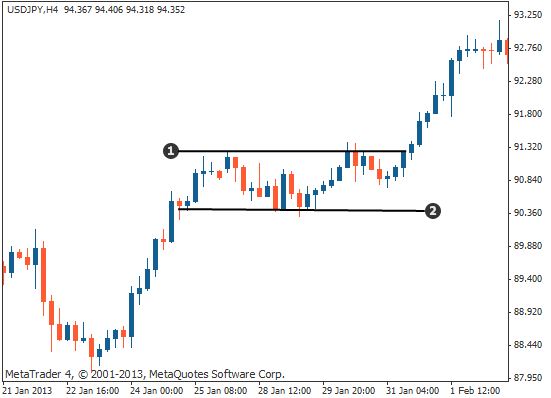
Figure 1- Rectangle Chart Pattern Breakout
Bullish Rectangle Chart Pattern in an Uptrend
A bullish rectangle pattern is formed in an uptrend and can signal a continuation of price, provided the breakout is to the upside. Alternately, a downside breakout from the rectangle pattern after an uptrend can result in a reversal breakout and can signal declines in prices.

Figure 2: Bullish and bearish rectangle breakout
Bearish Rectangle Chart Pattern in a Downtrend
In a bearish rectangle pattern, you can typically see a downtrend in price following which the consolidation takes the shape of a rectangle pattern. From this consolidation, a downside breakout will signal a continuation to the previous downtrend. However, if price reverses and breaks out to the upside, the bullish rectangle pattern will be a reversal pattern in this instance. Figure 2 depicts both a bullish and a bearish rectangle patterns including the minimum price objective following the breakout.
Rules for Trading the Rectangle Chart Pattern Formation
Trading the rectangle pattern breakout is very simple. First identify the pattern where you can see a minimum of two highs and two lows being formed within a sideways range. The next step is to determine the direction of the breakout.
Once the breakout direction is detected, then measure the distance of the rectangle from the high to the low and then project the same from the breakout level which becomes the minimum target level. You can set the stop losses to the previous swing low (for a bullish rectangle breakout) or the previous swing high (for a bearish rectangle breakout). Sometimes, the breakout when accompanied by strong volume can also signal another validation to the trade which traders can bear in mind.
Trading the Rectangle Formation as a Reversal Chart Pattern Strategy
The reversal rectangle is ideally seen at the tops or at the bottoms of an uptrend or a downtrend. However, there is no telling that a rectangle pattern formed at the top (or a bottom) will signal a reversal as sometimes, this could be a continuation pattern as well. Therefore, it is always best for traders to wait for the breakout from the rectangle pattern and trade accordingly.
To conclude, the rectangle pattern is quite simple and can signal some good breakout strategies. However, due to the fact that the minimum price projection is just the height of the rectangle, the profits can be limited especially when price moves strongly in the direction of the breakout.
The post Breakout Trading Strategy Using the Rectangle Chart Pattern Analysis appeared first on Advanced Forex Strategies.
from Advanced Forex Strategies


No comments:
Post a Comment