a-ads

Saturday, September 23, 2017

[FOREX TIP] The Parabolic Curve Pattern

The Parabolic Curve Pattern, as the name suggests is a chart pattern that resembles that of a parabolic curve. It is not found that often, thus making it a very rare pattern in the markets. It is also one of the most sought after chart patterns as it signals a reversal in price. Although one might think that the parabolic curve requires price to move in a certain curved fashion, it is nothing but a series of sharp moves in price that can be plotted using multiple trend lines.

The Parabolic Curve Pattern usually occurs during sharp market movements. Such strong moves are led by a market speculation that gets ahead of itself. Traders often find themselves front-running an event. Thus, one of the common ways to identify a potential parabolic curve pattern is the period ahead of a bit event. An important point to note is that just because price moves in a parabolic shape it doesn’t mean that price will break the parabolic curve. There is a good chance that price will continue to move within this fashion for a significant period of time. This is eventually decided by the market forces.

How is the Parabolic Curve Pattern Formed?

The Parabolic Curve Pattern pattern is found usually in an uptrend. Here, you can expect prices to make shallow higher lows while posting strong higher highs. The first chart below in figure 1 shows a parabolic curve pattern.

Figure 1- Parabolic Curve Pattern

This is how an ideal Parabolic Curve Pattern looks like but is to be used only for reference purposes. In the real markets, you will seldom find such as text-book perfect parabolic pattern. Secondly, the parabolic curve is not really a curve but a series of trend lines that tend to become steeper when you plot the lows in price.

Sometimes, the pattern can require just two trend lines (a minimum of two trend lines is required, with the second trend line becoming steeper than the first one) and at times it can take even four or five trend lines. In figure 2, we have a sample parabolic curve pattern which takes just two trend lines. You can see that while the first trend line was inclined at an average of 45 degrees, the second trend line is steeper than the first.

Figure 2 – Parabolic Curve Pattern in EURUSD

Although the above pattern is not near the textbook illustration, you can see how the sharp move in price has caused the parabolic pattern. One important thing of note is the fact that it takes quite a while for the pattern to be formed. In most cases the parabolic pattern can be identified only close to or near the breakout of the pattern. Traders need to be quick in identifying this pattern and trade accordingly. The price action on the breakout can sometimes be very fast as traders begin to unwind their trades. Thus catching the trade at the right point is essential.

Why the Parabolic Curve Pattern is Powerful Reversal Trading Pattern?

The Parabolic Curve Pattern is a powerful chart pattern firstly because the price climbed too high and too fast. This kind of steep climb is not sustainable and a reversal in price is expected whenever this chart pattern occurs. Secondly, the time frame require to form the parabolic curve requires a lot of patience. Unlike other chart patterns such as the head and shoulders or the cup and handle pattern, the parabolic curve pattern can take a lot of time to form. Thus, traders need to be very patient in order for the parabolic curve pattern to be formed and to be ready when the breakout occurs.

As noted earlier, the parabolic curve pattern comes due to speculative moves from the markets. For example in November last year as the U.S. Presidential elections concluded, the markets posted a strong rally in anticipation that Trump would announce fiscal stimulus measures that he promised during his campaign trail.

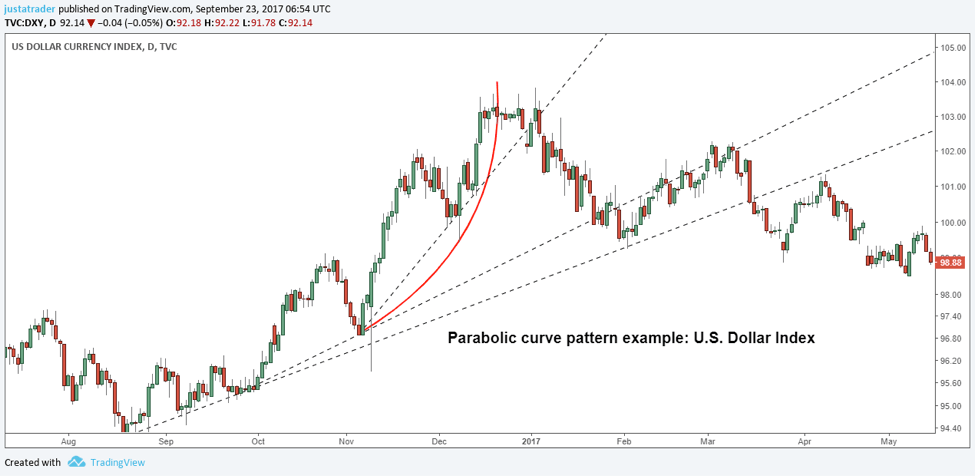
Figure 3 – Parabolic curve pattern breakdown in the U.S. Dollar Index

This led to the markets front-running the event even before an official announcement could be made. This sharp rally led to a parabolic shape projection in prices. As seen in figure 3, following the breakdown of the parabolic curve pattern, price posted a sharp decline.

How to effectively trade the Parabolic Curve Pattern

To effectively trade the parabolic curve pattern, the first step is to broadly look at all the instruments. Identify currency pairs where there has been a speculative move. Recent examples include the current rally in EURUSD which has been in an uptrend since June this year. Another example would be the GBPUSD rally which has posted sharp gains in just a matter of a month or two. Such strong moves in the markets typically result in a parabolic pattern breakout when the actual news falls short of market expectations.

The trading rules for the parabolic curve pattern are very simple. Because this pattern is formed in an uptrend, you will be looking at taking short positions. Start by plotting trendlines (minimum of two) and then plot the highs as well. The parabolic curve pattern is broken down into three bases; the first, second and third highs (figure 1). When you connect the lows of these three bases, you typically get the parabolic curve pattern. At the top end of the rally, after the parabolic curve is breached, wait for price to move below base 3 and go short. You can target bases 2 and 1 and book profits accordingly. The stops obviously come in at the top. Figure 4 shows the typical entry/exit and stop loss levels.

Figure 4 – Parabolic Curve Pattern trading rules

As you can see in the above illustration, after bases 1, 2 and 3 are formed, price breaks below the base 3 which triggers the short position. Eventually the targets of base 2 and 3 are eventually reached. The stops, set at the high can be moved to break even when you reach the first target.

The Parabolic Curve Pattern

To conclude, the parabolic curve pattern can be a powerful way to trade the markets. The general rule of the trading world is that if the price is climbing too fast, this kind of rise cannot be sustainable. The Parabolic Curve Pattern serves to point this rule to us and if we keep our emotions aside, it’s really not too difficult to spot the Parabolic Curve Pattern.

Do remember that price action can be extreme and it’s really not for the weak mind to trade this chart pattern. In order to be successful with trading this pattern, traders must focus on good money management skills and also must have some self confidence in their decision making. Good luck! Comment below to let us know your thoughts.

The post The Parabolic Curve Pattern appeared first on Advanced Forex Strategies.


from Advanced Forex Strategies

[FOREX TIP] AUDUSD Weekly Forex Forecast – 25th to 29th Sept 2017

AUDUSD Weekly Forex Forecast – 25th to 29th Sept 2017

The AUDUSD continues to respect the current consolidation range. Last week we weren’t able to sustain the gains above the big psychological number 0.8000 and more we even closed the week below the big round number. The current year high 0.8124 remains the big resistance level and while we trade below, we should expect at least more ranging activity.

We have an intraday support level at last week low 0.7908 followed by a much bigger support level at 0.7875. The stochastic indicator is also moving away from oversold conditions and we might expect the current minor bounce to continue early in the week. The view remains unclear as long as we trade within the limits of the current range. Only a break on either side of the range can be the catalyst for some trend development. There are no major risk events scheduled on the Australian economic calendar. In this regard, we should expect a more technical driven AUDUSD exchange rate.

Previous AUDUSD Weekly Forex Forecast

AUDUSD Weekly Forex Forecast – 25th to 29th Sept 2017

The post AUDUSD Weekly Forex Forecast – 25th to 29th Sept 2017 appeared first on Advanced Forex Strategies.


from Advanced Forex Strategies

[FOREX TIP] USDCAD Weekly Forex Forecast – 25th to 29th Sept 2017

USDCAD Weekly Forex Forecast – 25th to 29th Sept 2017

The USDCAD bearish trend has finally managed to take a pause and we saw a retracement. Last week high 1.2390 now remains an important resistance level and while we trade below this level we should expect the bearish trend to continue resuming downwards. A break above 1.2390 will expose 1.2410 and more importantly the big round number 1.2500.

The stochastic indicator is moving away from overbought conditions and now the downside has more changes to prevail. The first level of support comes in at 1.2250 followed by current year low 1.2064. A break and a close below 1.2064 will open up the door for a retest of the big psychological number 1.2000.

The Canadian economic calendar only has one major risk event scheduled on Friday when we have the Canadian GDP figures. The Canadian economy grow rate beat market expectation by 0.3% during the last month. According to IMF the Canadian economy is expected to have the fastest growth rate among G7 countries.

Previous USDCAD Weekly Forex Forecast

USDCAD Weekly Forex Forecast – 25th to 29th Sept 2017

The post USDCAD Weekly Forex Forecast – 25th to 29th Sept 2017 appeared first on Advanced Forex Strategies.


from Advanced Forex Strategies

[FOREX TIP] GBPUSD Weekly Forex Forecast – 25th to 29th Sept 2017


GBPUSD Weekly Forex Forecast – 25th to 29th Sept 2017

The GBPUSD has consolidated the recent gains and only closes the week slightly down from where it opened. We’re still trading above the big psychological number 1.3500 but we were only able to post a marginal weekly close above the round number. In this regard, we can’t rule out a deep below 1.3500 for a retest of intraday support level 1.3350.

The stochastic indicator also as some room left until it really enters in oversold territory, so it supports the idea of an early retest of 1.3350 before the bullish trend resume. Last week low 1.3450 remains another significant support level while on the upside, we have 1.3657 resistance level. A break and a daily close above last week’s high will open up the door for a retest of the 1.4000 big round numbers.

The UK economic calendar has enough risk events to cause some volatility in the market. On Monday we have the Financial Policy Committee, which includes assessment of potential risks to financial stability. Tuesday we have the Inflation Report Hearings while on Wednesday we have the UK GDP figures for the second quarter. The UK is expected to post an annualized rate of 1.7% economic growth rates. On Thursday, the US GDP figures are the main risk event and based on the market consensus we should expect the US economy to publish an impressive 3% growth rate.

Previous GBPUSD Weekly Forex Forecast

GBPUSD Weekly Forex Forecast – 25th to 29th Sept 2017

The post GBPUSD Weekly Forex Forecast – 25th to 29th Sept 2017 appeared first on Advanced Forex Strategies.


from Advanced Forex Strategies

[FOREX TIP] Weekly Forex News Events for EURUSD – 25th to 29th Sept 2017

EURUSD ended the week by producing a Doji candle on the Weekly chart. The next week has some high impact news events, thus the pair might make some interesting moves in the week ahead. Let us have a look at those news events.

Monday-25th September- GMT 13.00

ECB President Draghi speaks

This news event is always a big one for the EURUSD traders. Many opportunities can be found just after the news event.

Tuesday-26th September- GMT 14.00

CB consumer confidence

Intraday traders should be careful about this news event. It often produces spikes and sweeps away intraday stop losses.

Tuesday-26th September- GMT 16.45

Fed chair Yellen speaks

It is not as big as the ECB president’s speech. However, traders should be careful with their intraday positions before this news event hour.

Wednesday-27th September- GMT 12.30

Core durable goods orders m/m

This is another news event, which ends up producing long spike. Thus, intraday traders should deal with this carefully.

Wednesday-27th September- GMT 14.30

Crude oil inventories

It does not always get that volatile, but it has the potential to make the pair very volatile. Some good entries can be found after the news impact as well.

Thursday-28th September- GMT 12.30

Final GDP q/q/

Unemployment Claims

Basically, “Unemployment claims” data is going to make the pair volatile. EURUSD traders will wait for this news event to take some entries.

Friday-29th September- GMT 14.45

ECB President Draghi speaks

This would be his second speech in the next week. It can be assumed that this one would make the pair more volatile than the Monday’s one.

The post Weekly Forex News Events for EURUSD – 25th to 29th Sept 2017 appeared first on Advanced Forex Strategies.


from Advanced Forex Strategies

CryptoCurrency News: Welcome to Bitcoin Country: Silk Road and the Lost Threads of Agorism

Silk Road and black markets? University of Dublin's Paul Ennis takes a dive into the kinds of sub-cultures bitcoin and cryptocurrencies enable.

via CoinDesk

CryptoCurrency News: Better in Byzantium? Ethereum Takes Baby Steps Toward a Privacy Boost

The upcoming "Byzantium" hard fork of ethereum will usher in new cryptographic procedures that should eventually pave the way for increased privacy.

via CoinDesk

bitcoin faucet

Popular Posts