a-ads

Saturday, September 2, 2017

[FOREX TIP] Understanding Support and Resistance Levels in Forex Trading

Support and resistance levels are one of the key cornerstone elements when it comes to trading. It not just applies to the forex markets but nearly any financial market that you want to analyze. Whether you are trading based off indicators or price action there is no way one can avoid learning about support and resistance levels. Therefore it is important for the trader to thoroughly understand what these levels are and what they mean for your trading.

The Importance of Support and Resistance

Not understand how support and resistance levels work can be disastrous to your trading. Most traders seek the easy way out and make use of custom technical indicators that can plot these levels. Easy and convenient as it may sound, the fact remains as the trader is still dependent on these indicators. And many a times, the automated support and resistance levels don’t work as promised.

This is because there is some subjectivity involved when it comes to plotting these levels, something which an indicator cannot do. Therefore, the sooner one learns how support and resistance works, the better they can improve their trading. Let’s begin by first understanding what is support, and what is resistance?

Definition of Support

Support level is defined as technical level in a price chart where there is a lot of demand for the security. Because of this demand, traders tend to buy the security in question, thus leading to a “support.”

When price trades at a support level it will appreciate or rise or rally from the support level. Obvious from the above definition, you never make the mistake of selling at a support level. From a trading standpoint however, you can buy from a support level or you can target your short position to a support level.

Definition of Resistance

Resistance levels are defined at a technical level in a price chart where there is a lot of supply or selling pressure at a particular price or at a price region. Due to this strong measure of supply or sellers, prices often fall due to the heavy selling. Again, it is obvious that you never buy at a resistance level. On the contrary, you can target your long positions to a resistance level or you can sell at a resistance level.

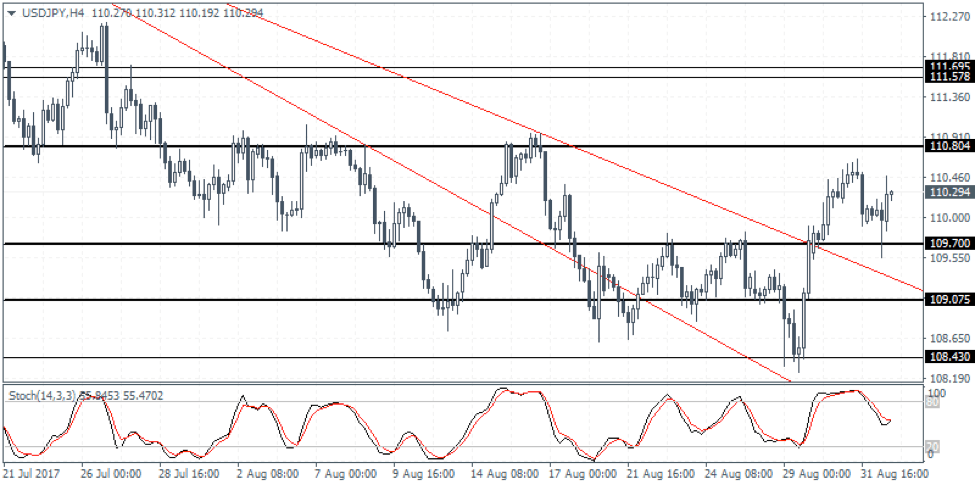
Most traders make the mistake of thinking that support and resistance levels are just mere price points. They are partly right. A support or a resistance level can either be a single price point or it can be a region as well. For example, in USDJPY 110.25 might be a support, but 112.25 – 112.00 can also be a support region or a level of demand. It is always best to have some flexibility when drawing the support and resistance levels.

Experience shows that you are better off in plotting a range for support and resistance levels as it can help you to deal better with any spikes in prices. Now if you traded with just a single price level, chances are that you will get scared out of your position when there is a price spike. The first chart below shows a support level on a daily chart.

Figure 1: Support level example

In Figure 1, you can see that the support zone or a price region was selected. You can see that after first bouncing off this support level (or area of demand), price eventually falls back to this level at the very right side of the chart. From here, we can see another leg in the rally in price. The next example shows a resistance level on the chart.

Figure 2: Resistance level example

In Figure 2, you can see how the resistance level is plotted and how price reacts to it. Every rally to this region is met with resistance thus resulting in falling prices.

How Support and Resistance levels reverse in their roles?

So far we have learned that a support level is an area of demand with buyers in majority and as a result the higher demand leads to higher prices or a bounce. A resistance level is an area of supply and sellers in majority. As a result, price often falls from a resistance level. However, a support level can quickly change to become a resistance level and a resistance level can quickly change to become a support level. This reversal of roles occurs when price breaks past the level.

For example, if a support level was broken and price fell through the area of demand, you can expect this level to become resistance where supply or sellers will overwhelm the buyers. Similarly, a resistance level that is broken by price rallying above this level can quickly be tested by price as a support level as well. This reversal of support to resistance and resistance to support provides some great trading opportunities. The first example below shows how a support level turns to resistance and vice versa.

Figure 3: Support turns to resistance and resistance turns to support

What you see in figure 3 is the support level that was initially established. Following a brief bounce off this support level, price then breaks this support. After falling below this support, the rally back to this level is met with resistance.

This support turned resistance level is tested twice before price manages to break past this resistance. Obviously, there was a quick retest for support at this level before price managed to rally higher.

Entry and stop loss for support and resistance levels

By now it should be quite obvious on where to place your entries. Typically for long positions that you take a support level, you can set your entry to or close to above the support level. This will increase the chances of your trade being triggered. For stop loss, it is best to set the stop loss level a few pips below the support level. It is always best to look to the left for any key swing lows and set the stop loss level a few pips below this key swing low.

For short positions which typically occur at a resistance level, your entry will be a few pips below or close to the resistance level. And for stop loss levels, you would place your stops a few pips above the resistance level or a few pips above the nearest swing high. Don’t forget to also consider your risk/reward ratio when setting the stop loss levels.

The Rules in Trading Support and Resistance Lines

We can now summarize the rules for determining how to draw the support and resistance levels.

  1. A support level is where there are more buyers than sellers. Therefore, due to the high area of demand, price will often bounce or rally from a support level. Ideally, you are better positioned to be on the long side near a support level
  2. A resistance level is where there are more sellers than buyers. Therefore, due to the high area of supply, price will often fall or decline from a resistance level. Ideally, you are better positioned to be on the short side near a resistance level
  3. Support and resistance levels can either be a strict price point or a price zone
  4. Do not expect strict reversals at support or resistance levels. Price often tends to spike and take out the stops (also known as stop hunting) near the support and resistance levels
  5. A support or a resistance level can be broken. You will find this to happen when it coincides with a strong catalyst such as an economic release or comments from central banks
  6. When a support level breaks it turns to resistance and when a resistance level breaks, it can turn to support
  7. Identifying candlestick reversal patterns such as doji or Harami or engulfing candlestick patterns can help to improve your trading confidence with support and resistance levels

The post Understanding Support and Resistance Levels in Forex Trading appeared first on Advanced Forex Strategies.


from Advanced Forex Strategies

[FOREX TIP] Weekly Forex News Events for EURUSD – 4th to 8th Sept 2017

EURUSD had an eventful last week. The pair ended the week with bearish bias. However, the overall trend is still with the bull. There are not too many high impact news events next week. Let us have a look at those high impact news events that might create volatility next week…

Wednesday- 6th September 2017- GMT 14.00

  • ISM manufacturing PMI

A news event, which should be dealt carefully by the intraday traders. It does create some excellent trading opportunities as well for the intraday traders.

Thursday-7th September 2017- GMT 12.30

  • Unemployment Claims

This news event would create most volatility next week. Thus, traders will be eying on this news event to find out trading opportunities. If we consider the data of “Unemployment claims” for the last 3 weeks, then we would have to agree that the data has been doing well. On 17 August, the claim was 232 K and the forecast was 240 K; on 24 August, the claim was 234 K and the forecast was 237 K; on 31 August, the claim was 236 K and the forecast was 237 K.

It can be assumed that the data for the next week would be a good one for the USD. If it really is, then the pair might make some good bearish moves with the help of strong US “Unemployment data”.

Thursday-7th September 2017- GMT 15.00

  • Crude oil inventories

This news event does not always create volatility, but traders should deal with this very carefully since it could make the pair very volatile.


The post Weekly Forex News Events for EURUSD – 4th to 8th Sept 2017 appeared first on Advanced Forex Strategies.


from Advanced Forex Strategies

[FOREX TIP] Forex Psychological Levels: Why Do They Work and How to Trade Them!

When trading the markets, you might have heard about the term “psychological level.” If you were wondering what this meant then fret not. Psychological level is a term that is used in the markets when price is approaching a key level. The psychological level is nothing a common round number. For example, if you consider the EURUSD chart, levels of 1.10, 1.20, 1.30, etc. are considered key psychological levels.

The reason why psychological levels are important is because they play a key role as support and resistance levels in the market. Many institutional entities and financial hedge funds tend to trade based off these levels.

Why Do Forex Psychological Levels Work?

Obviously, setting your trade entry or exit at levels such as 1.10 or 1.20 sounds more reasonable and simple compared to placing a buy or a sell order at 1.10192 or 1.2019. Another reason why the psychological levels are used is because they are also easy to identify. You can see psychological levels at work in almost every market that you analyze.

Let’s look at a very recent example. In late August, early September of 2017, EURUSD rallied towards a psychological level of 1.20. As expected, price promptly reversed at this level. The chart below shows this example…

Forex Psychological Level of 1.20 and EURUSD reaction to this

In the above chart you can see that first, EURUSD broke the psychological level of 1.20. Following this break, price continued to decline further. Finally, after years, quite recently, EURUSD approached this level again. You can see how quickly EURUSD posted a reversal. What this means is that when a psychological level is broke, you can expect price action to continue in the direction of the trend. Likewise, when a psychological level is tested and price reverses you can expect the reversal in prices.

Besides the EURUSD example, and widely cited phenomenon is Gold and also oil charts. In Gold, the psychological levels are the $1000, $1100, $1200, etc. levels. When gold prices reach these levels you can expect the markets to become very active. Traders will be looking at how price reacts to these levels. If price breaks the level, then you can expect a flurry of buying activity if the breakout is to the upside for example. The next chart is that of gold with $1200 and $1300 psychological levels shown on the chart.

Psychological Levels Respected Even in Gold or XAUUSD

In the above chart you can see how the psychological level of $1200 was tested twice. Because price first broke the $1200 level and then fell back, you can see increased buying activity in the gold market. Finally, the recent breakout of $1300 psychological level is another indicator to the upside.

No sooner will gold prices drop back to $1300, you can expect support to be formed here as buying activity increases strongly at this psychological level. Depending on the markets that you trade, you can also make use of volume to understand if a break of a psychological level will hold or not. By combining not just price but also volume, traders can get additional validity.

Remember that just because price is approaching a psychological level it will not behave the way you want to. Therefore, traders who set their orders at psychological levels without analyzing the markets can be risk of a losing trade. Based on the time frame that you are trading, psychological levels can change. For example on an intraday chart, you can think of 1.125 or 110.50 or 109.25, etc. as psychological levels.

How Can You Use these Forex Psychological Levels to Trade?

A psychological level can be used as a regular support and resistance level. When price is approaching a round number, you need to pay extra attention to this. Because just about every trader is watching the number it gains more importance. Psychological levels can be used on intraday charts too. The chart below shows the EURUSD 4-hour chart. Here, we use the psychological levels of 5. Thus you can see price levels such as 1.115, 1.1250, etc.

Psychological levels in action on intraday charts

If you observe the chart closely you will see how price reacts to these levels. Now with the psychological levels, traders can then analyze the chart and plot potential levels of support and resistance. Notice the support and resistance level identified around 1.0850. You can see how this level first served as support and after breaking this level, price then tests this very level where resistance is formed (seen in the next chart below).

Important support and resistance levels are formed when there is confluence with psychological levels

Traders can also make use of candlestick patterns or other technical indicators to understand what price will be doing when it reaches a key psychological level. While it might sound tempting to rush into a trade at psychological level, it is always important to not what price action will be doing at this level.

In conclusion, psychological levels are merely key round numbers in a price chart. They gain importance as almost all traders keep an eye out for these levels. Depending on how price reacts and based on your analysis, you can build a profitable way to trade based off these psychological levels.

The post Forex Psychological Levels: Why Do They Work and How to Trade Them! appeared first on Advanced Forex Strategies.


from Advanced Forex Strategies

[FOREX TIP] AUDUSD Weekly Forex Forecast – 4th to 8th Sept 2017

AUDUSD Weekly Forex Forecast – 4th to 8th Sept 2017

The AUDUSD is challenging the big psychological number 0.8000 but the inability to post a weekly close above it suggest that we should expect more consolidation ahead. However, the current trading range extends between 0.8065 swing high and support level 0.7790.

The stochastic indicator is already in oversold territory, so if the market decides to go lower the first level of support comes in at 0.7875. On the upside a daily break and close above 0.8000 will not be enough to suggest the bulls are in control, for that we need a close above 0.8065. The Australian economic calendar looks busy with plenty risk events that can distort the price. Tuesday will bring the RBA interest rate decision and the market consensus anticipates no change in the monetary policy as interest rates are expected to be kept at 1.5%. Wednesday we have another important data, the GDP figures which are expected to slightly come higher at 1.8% versus 1.7% previous reading. Thursday we have the Retail Sales figures and Trade Balance numbers which have the potential to produce some volatility.

Previous AUDUSD Weekly Forex Forecast

AUDUSD Weekly Forex Forecast – 4th to 8th Sept 2017

The post AUDUSD Weekly Forex Forecast – 4th to 8th Sept 2017 appeared first on Advanced Forex Strategies.


from Advanced Forex Strategies

[FOREX TIP] USDCAD Weekly Forex Forecast – 4th to 8th Sept 2017

USDCAD Weekly Forex Forecast – 4th to 8th Sept 2017

The USDCAD has broken to new lows for 2017 after a quite volatile week of trading. Last week low 1.2339 remains now key for the future direction of the price action. A daily break and close below will extend the current sell off down to 1.2200. However, the stochastic indicator is already in oversold condition so we might see first another attempt to retest 1.2410 next important resistance level.

The crucial level remains the big psychological number 1.2500 and a daily break and closes above will invalidate the current attempt to break lower. The Canadian economic calendar looks heavy in terms of risk events. But, first, we need to mention that Monday is the Labor Day and the market liquidity, should dry so we need to be careful not to get caught by some erratic price action.

Wednesday is the big day for the Canadian dollar as we have the BOC interest rate decision. While the market is expectation is for the interest rate policy to be kept unchanged, we should look for any changes in BOC hawkish rhetoric. Friday we have the Unemployment rate figures and based on the market consensus, we should expect a flat reading of 6.3%.

Previous USDCAD Weekly Forex Forecast

USDCAD Weekly Forex Forecast – 4th to 8th Sept 2017

The post USDCAD Weekly Forex Forecast – 4th to 8th Sept 2017 appeared first on Advanced Forex Strategies.


from Advanced Forex Strategies

[FOREX TIP] GBPUSD Weekly Forex Forecast – 4th to 8th Sept 2017


GBPUSD Weekly Forex Forecast – 4th to 8th Sept 2017

The GBPUSD has gained a little bit of momentum to the upside, but the current price structure still looks corrective in nature. We’re consolidating right below the big psychological number 1.3000 but the unwillingness to break above 1.3000 after to failed retest is a bearish sign. The stochastic indicator is already in oversold condition so we can head lower anytime soon. However a daily break and close above 1.3000 will open up the door for a retest 1.3114 next important resistance level.

On the downside, the first level of support stands at 1.2854 last week low followed closely by 1.2840. A break below will expose August low 1.2774. The UK economic calendar looks busy as we have some noteworthy risk events that can cause some spike in volatility. Monday we have the PMI Construction figures which are expected to inch higher to 52. Tuesday we have the Inflation Report Hearings and the Markit Services PMI, which based on the market consensus we should expect a softer reading of 53.5. Last but not least, on Friday we have scheduled the Trade Balance figures and the Industrial Production which again is seen to disappoint.

Previous GBPUSD Weekly Forex Forecast

GBPUSD Weekly Forex Forecast – 4th to 8th Sept 2017

The post GBPUSD Weekly Forex Forecast – 4th to 8th Sept 2017 appeared first on Advanced Forex Strategies.


from Advanced Forex Strategies

CryptoCurrency News: Report: China's Regulators Close to Taking Action Against ICOs

Reports from anonymous sources in China indicate the country's top financial regulator may be close to cracking down on initial coin offerings.

via CoinDesk

CryptoCurrency News: Bitcoin Drops Below $5,000 as Crypto Markets See $13 Billion Sell-Off

The cryptocurrency asset class saw a broad sell-off on Saturday after bitcoin passed a notable milestone in its price history.

via CoinDesk

CryptoCurrency News: Blockstack Today: 5 Apps Already Being Built on the Decentralized Web

A look at the applications using Blockstack's platform give insight into what kind of future the startup is looking to cultivate.

via CoinDesk

[FOREX TIP] USDCHF Weekly Forex Forecast – 4th to 8th Sept 2017

USDCHF Weekly Forex Forecast – 4th to 8th Sept 2017

Technical Outlook: The USDCHF posted some declines last week as price fell to 0.9450 level before posting a strong pullback. With prices now comfortably settled above 0.9564 support, we can expect to see a breakout from this ranging price action. USDCHF has remained stuck within 0.9730 resistance and 0.9564 support level. A breakout from this range could potentially suggest further near term direction. We expect that the breakout will result in a rally which will see USDCHF testing the major resistance level that will form at 0.9861 – 0.9849. To the downside, USDCHF has already signaled the strong support near 0.9450.

Fundamental Outlook: Switzerland will be releasing its quarterly GDP numbers this week along with the inflation report. Data is unlikely to move the Swiss franc much with focus turning to the U.S. Data from the U.S. includes factory orders followed by the ISM’s non-manufacturing PMI numbers which could play an important role in shaping the near term outlook for the U.S. dollar. As the Fed will be holding its monetary policy meeting in a few weeks, the economic data will be closely in focus by investors.

Previous USDCHF Weekly Forex Forecast

USDCHF Weekly Forex Forecast – 4th to 8th Sept 2017

The post USDCHF Weekly Forex Forecast – 4th to 8th Sept 2017 appeared first on Advanced Forex Strategies.


from Advanced Forex Strategies

[FOREX TIP] USDJPY Weekly Forex Forecast – 4th to 8th Sept 2017

USDJPY Weekly Forex Forecast – 4th to 8th Sept 2017

Technical Outlook: The USDJPY broke the falling trend line last week and also made a brief pullback to retest the breakout level and support at 109.70. Following this move, USDJPY could be looking to test the 110.88 resistance. While further gains can be expected on a breakout above 110.88, USDJPY could still struggle near this resistance level. This could potentially keep USDJPY to post another brief round of declines towards 109.07 region. Such a move will likely see USDJPY forming an inverse head and shoulders pattern with the right shoulder likely to coincide near 109.07. This would also push the bullish bias in USDJPY towards 113.00.

Fundamental Outlook: It is going to be a rather quiet week from Japan with the exception of some economic releases. The final GDP numbers for the quarter will be coming out. In the previous release, data showed that Japan’s GDP was revised from 0.6% to 0.3% on a quarterly basis. Compared to the same quarter a year before, Japan’s GDP was seen at 1%. Despite the rather modest numbers, the GDP data showed that Japan’s economy was expanding for the past five quarters marking an uninterrupted streak of growth in the economy. This is likely to bode well for the yen. Besides the GDP data, the current account data and the final GDP price index numbers will also be something to watch out for.

Previous USDJPY Weekly Forex Forecast

USDJPY Weekly Forex Forecast – 4th to 8th Sept 2017

The post USDJPY Weekly Forex Forecast – 4th to 8th Sept 2017 appeared first on Advanced Forex Strategies.


from Advanced Forex Strategies

[FOREX TIP] EURUSD Weekly Forex Forecast – 4th to 8th Sept 2017

EURUSD Weekly Forex Forecast – 4th to 8th Sept 2017

Technical Outlook: The EURUSD continued to maintain its bullish course last week as price was briefly bid up to test the 1.2000 handle. However, failure to hold on to the gains saw the common currency giving up those gains quite easily to close on Friday at 1.1860. The upside move looks to be completed based on the breakout from the triangle pattern. With price now approaching 1.1825, we can expect some near term retracement as long as this support level holds. EURUSD could remain broadly supported above 1.1825 level into Thursday’s ECB meeting. However, any gains above 1.1825 support is likely to be limited as we expect EURUSD to decline towards 1.1565 which is a key support region that will be tested in the medium term.

Fundamental Outlook: It will be a busy week for the euro currency as all eyes turn to this Thursday’s ECB monetary policy meeting. The fact that the ECB president is expected to announce a tapering to the central bank’s QE program is widely priced in, leaving out not much scope for further upside in the common currency. Still, the devil will be in the details especially as Draghi will have to balance out his speech in order not to let the euro rally further. As a result, the ECB press conference gains prominence with investors likely to cling on to every word coming from Draghi. Needless to say, the euro could be seen trading volatile as the week progresses.

Previous EURUSD Weekly Forex Forecast

EURUSD Weekly Forex Forecast – 4th to 8th Sept 2017

The post EURUSD Weekly Forex Forecast – 4th to 8th Sept 2017 appeared first on Advanced Forex Strategies.


from Advanced Forex Strategies

bitcoin faucet

Popular Posts