
Buy Low and Sell High Using Range Trading Forex Strategy
Range trading is a simple strategy that can be used on almost any financial product although this article is mainly directed to currency pair trading. Range trading is pretty much just as is sounds, find the range that a product regularly trades in, buy low sell high in the case of a long order and sell high buy back low with a short order.
Useful Indicators in Range trading
The indicators below will be very helpful when figuring out when to buy and sell in your range keeping in mind that the price dictates where the indicators move, not the other way around. You may find it easier and more comfortable to trade a product that you are somewhat familiar with like your home currency. Staying close to home will also keep your trading costs down and likely allow for more leverage.

Stochastic Oscillator (5, 3, 3)
The Stochastic Oscillator compares the price at which a security closed relative to the range of the price over a certain period of time using two lines. The first of the two lines is called %K representing closing price and the second %D represents a moving average of the closing price. The oscillator has a full range from 0 to 100. Leaving values set by default will be fine, but you should edit the indicator and set an upper level of 80 and a lower level of 20. When the oscillator goes over the level of 80, it is considered to be overbought. It is considered oversold when dropping below the level of 20. Generally, values will increase as the 80 level is breached and continue to rally while above this level. The oscillator leaving the overbought area and dropping back below the 80 level is an indication that the price may have reached a ceiling and start to fall. The same concept holds true for when the oscillator drops below the 20 level into the oversold area which represents a declining value. A return above the 20 level suggests that the price may start to increase.
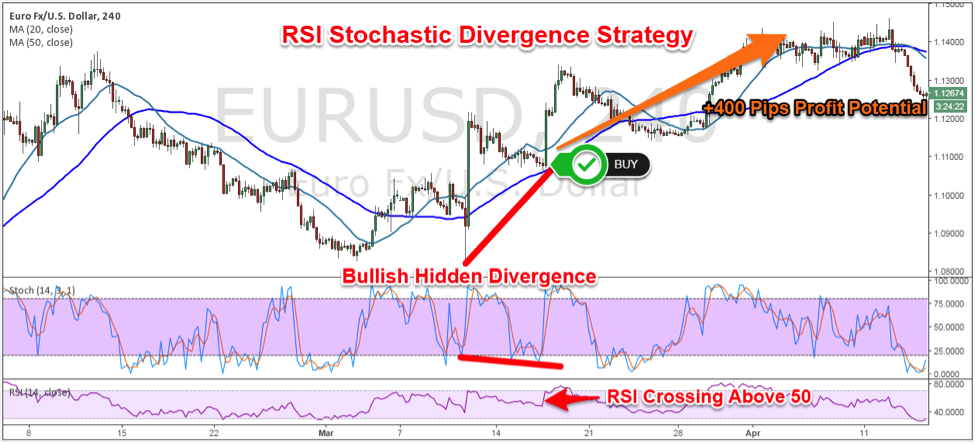
Relative Strength Index (RSI) and divergence
The Relative Strength Index is an oscillator that follows the value of the financial product being traded. The RSI oscillator has a full range from 0 to 100. It will most likely have a default 14 day period which is fine, but the indicator should be edited to include an upper level of 70 and a lower level of 30. When the RSI oscillator goes above the 70 level, it is overbought. It is oversold when dropping below the 30 level. A level of more than 70 may have a continued rally until the level turns downward and returns below 70 suggesting a possible end to the rally. A level of less than 30 may have a continued decline until the level rises and goes back above 30 suggesting a possible bottom.
A divergence occurs when and new high or low in price is not also a new high or low in the Stochastic Oscillator and/or Relative Strength Index. Value of the financial product may have a correction and follow in the direction of the RSI. To make this indication of a coming price drop stronger, look for the RSI level to drop below the level of the closest valley or low level. Divergence in CCI is much the same in that a new high price is not expressed as a new high level in the CCI suggesting a coming price correction.

ADX and Commodity Channel Index Indicator
The Commodity Channel Index is a measurement of the amount of deviation between the current price of the financial product and the average price. This oscillator does not have a full range but is centered on a value of 0. When setting up CCI, the indicator needs to be edited to show a high level of +100 and a low level of -100. Between these two levels is a channel with 0 at the center representing the average price. A high level of CCI, which would be considered to be anything above +100, means that the current price is high as compared to the average price for the product. A low level of CCI being anything below the level of -100 would be stating that the current price is low as compared to the average price.
This trend indicator is based on a 14 day period comparing two direction indicators, the positive direction indicator (+DI) and the negative direction indicator (-DI). The Average Directional Movement Index shows the strength of price movement while the positive direction indicator (+DI) and the negative direction indicator (-DI) show the direction of price movement.
Forex News Events
While it is possible to trade on technical analysis alone, it is really only half of the story. A great deal of the fluctuation in value that you are tracking with the technical analysis was caused by the release of information, reports and statistics relevant to your product and the countries involved. Economic news releases from the relevant statistics agencies from your country are essential to making good profits in currency pair trading just as financial reports and news updates are crucial to trading public company stocks. All statistics agencies have release calendars for important upcoming reports. For currency pairs, economic reports on GDP, trade balance, unemployment and income are a few critical reports that affect prices greatly. Find the agencies that release key economic numbers relevant to your product, bookmark them and be waiting anxiously minutes before their release. Find the analysts’ projections or forecasts on what the numbers should be before they are released. If the real numbers are better than the analysts forecast then prices will increase immediately, just as they will decrease if expectations are not met as real numbers are released.
Consider using a practice account for any new trading strategies before risking your money. Foreign exchange products are highly leveraged and often very volatile. Never invest money that you cannot afford to lose!


