
Triangle Chart Pattern Analysis
The Ascending and Descending Triangle Chart Patterns come under the category of reversal patterns. When these patterns are formed, you can expect the market to breakout from the pattern and post a reversal. This reversal can be either a change of trend or simply a retracement to the prevailing trend. The ascending and descending triangles, as the name suggests are bullish and bearish. There doesn’t have to be a strong trend for these patterns to occur and in most cases, you can often find these patterns emerging during sideways markets. In this article, we explore the details of the ascending and descending triangle patterns and how you can trade these reversal chart patterns effectively.
How is the Triangle Chart Pattern formed?
The ascending and descending triangle patterns are formed with prices making consecutive higher lows but meeting with a horizontal resistance, or price making a series of lower highs but meeting with a horizontal support level. The patterns are quite visible when you plot the horizontal support or resistance level and connect the highs and the lows which are slanting.
Although these patterns are considered to be reversal patterns, traders should be cautious as there are instances when price breaks out of the rising or falling trend line and continues to move in the opposite direction. This can be quite disastrous for those who wish to seek an early entry into the market. While this method can give you additional rewards, there is also a potential of being caught on the wrong side of the market. This is something unique to the ascending and descending triangle patterns and traders should therefore be very careful when trading these reversal patterns.
Trading the Ascending Triangle Chart Pattern
The ascending triangle pattern, as mentioned earlier is based on a horizontal resistance level. Price retests this level at regular intervals but fails to break it. As a result, price continues to move lower, but makes higher lows (which gives the name, ascending triangle). In figure 1, we have an example of an ascending triangle pattern.
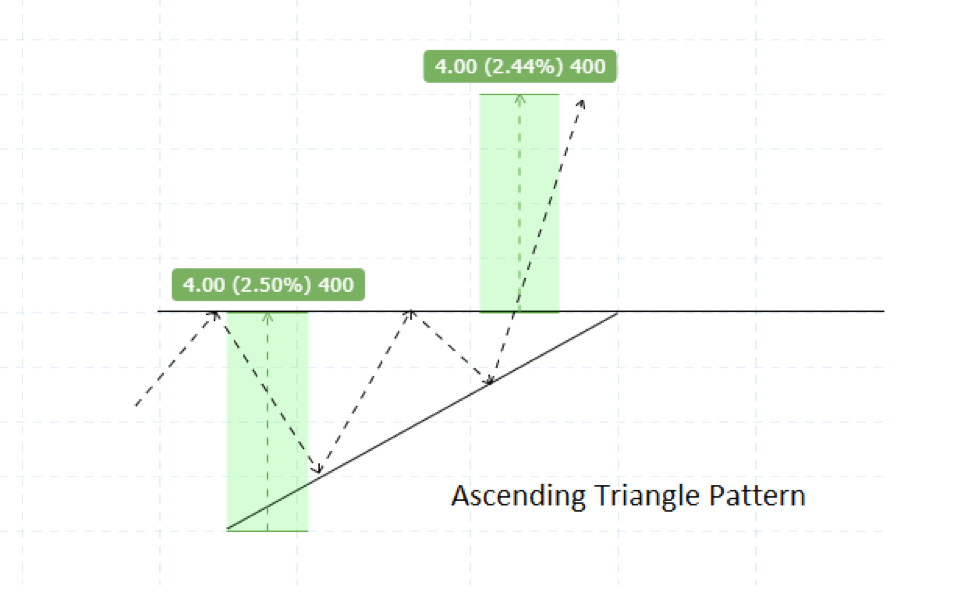
Figure 1 – Ascending Triangle Pattern Structure
As you can see in the above example, the ascending triangle is formed when price repeatedly tests the resistance level but fails to break it. In the mean time, every test of resistance results in price action making higher lows. When you connect these higher lows, you can see an inclined or rising trend line. Combining the horizontal resistance and the rising trend line, you get the ascending triangle pattern. The measured move is based on measuring the distance from the first low point to the resistance level and then projecting the same from the resistance level to the upside.
Ascending Triangle Chart Pattern Trading Rules
The trading rules for the ascending triangle pattern are very simple. Once the breakout of the resistance occurs, long positions are taken. Stops are placed at the recent swing low point. You can book profits at regular intervals. Note that sometimes, price can also drop back to retest the resistance level for support, which can bring additional opportunities to go long on the pattern. The next chart below shows an example of the ascending triangle breakout pattern.
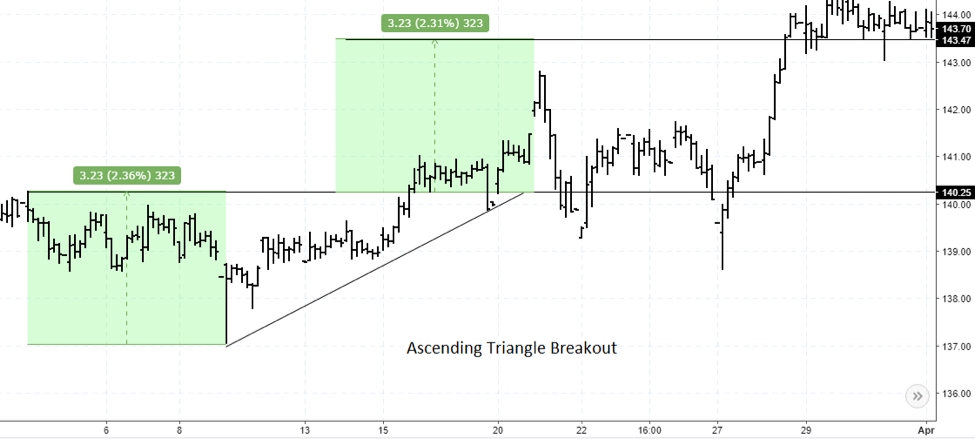
Figure 2 – Ascending Triangle Chart Pattern Breakout
In the above example, you can see how price initially rallied to the resistance but then made a low. Following this, price then makes subsequent higher highs and then retests the resistance level. After this you can see how price makes a breakout from the resistance level. Long positions are taken on the breakout and stops placed at the swing low point. In the above example, you can also see that price dips back to the resistance level to establish support, twice before rallying to the measured move target.
Trading the Descending Triangle Chart Pattern
The descending triangle pattern as the name suggests is marked by a series of lower highs and price unable to break the support in the process. What follows next is the breakout from the support level. This leads to a strong decline in prices. What is noticeable about the descending triangle pattern is the series of lower highs that are formed. Figure 3 shows an example of the descending triangle pattern.
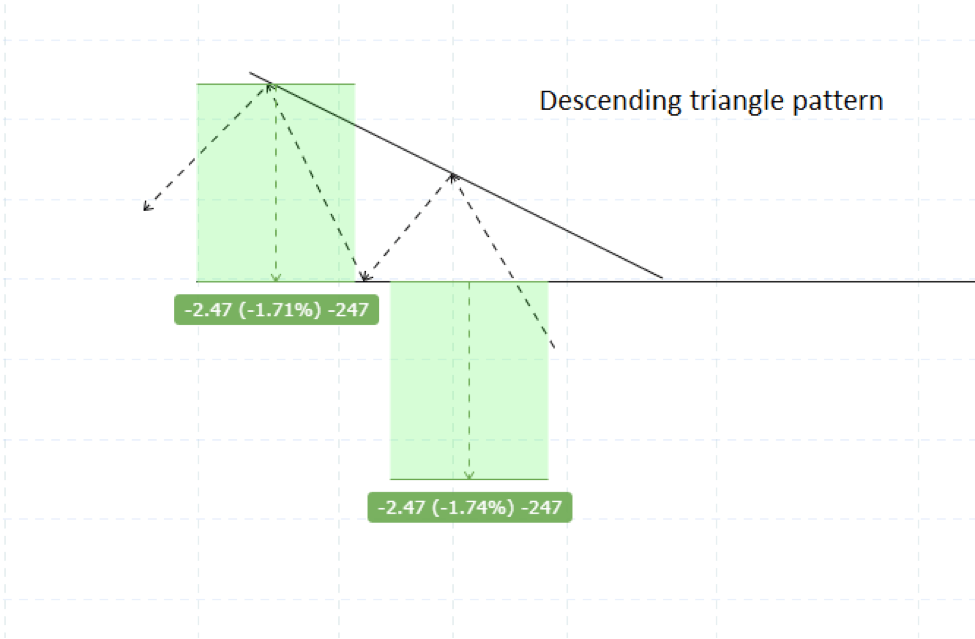
Figure 3 – Descending Triangle Chart Pattern
In the above example you can see how the breakout to the downside results in price action pushing lower after the support level is broken. The trading rules for the descending triangle pattern are similar to that of the ascending triangle pattern. Stops would be placed at the recent swing high following the breakout of the support level. The target is based on the measured move from the highest point to the support level and this is projected lower.
The Symmetrical Triangle Chart Pattern
Besides the ascending and descending triangle pattern, the symmetrical triangle pattern is another commonly occurring chart pattern. What’s unique about the symmetrical triangle pattern is the breakout. The breakout from this pattern will decide whether prices will rally or fall. Figure 4 illustrates the symmetrical triangle pattern. Here, you can see that the breakout can occur in either direction.
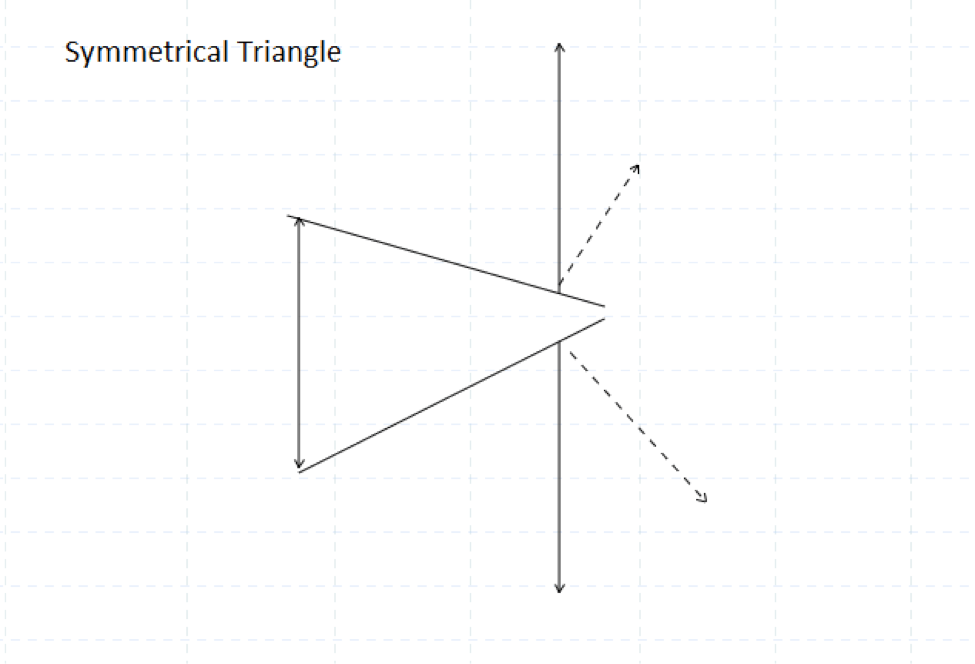
Figure 4 – The Symmetrical Triangle Chart Pattern
Once the breakout level is determined, the projection is taken from the high and the low of the symmetrical triangle pattern. Stops for the symmetrical triangle are placed either at the recent swing low prior to an upside breakout or a recent swing high prior to a downside breakout.
To conclude, the ascending and descending triangle patterns are simple to trade and occur quite frequently. While you can already determine the direction of the breakout with the ascending and descending triangles, with the symmetrical triangle, traders need to be a bit more patient as price can breakout in either directions.
The post Ascending Triangle and Descending Triangle Chart Pattern Analysis appeared first on Advanced Forex Strategies.
from Advanced Forex Strategies


No comments:
Post a Comment